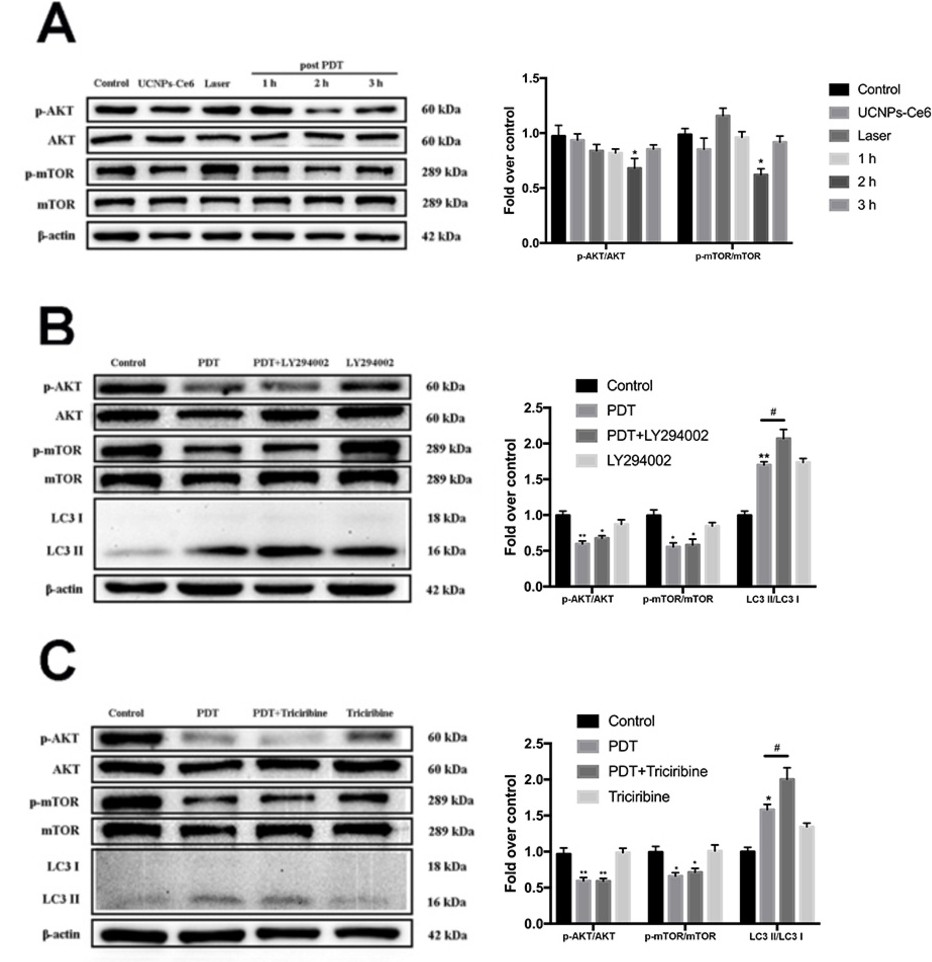
Fig. 5. PDT induced autophagy through the PI3K/AKT/mTOR signaling pathway. (A) The expression levels of p-AKT, p-mTOR, and LC3 II/LC3 I at various times after PDT (n = 10). (B) The effect of LY294002 on the expressions levels of p-AKT, p-mTOR, and LC3 II/LC3 I after PDT (n = 10). (C) The effect of triciribine on the expressions levels of p-AKT, p-mTOR, and LC3 II/LC3 I after PDT (n = 10). * P<0.05, ** P<0.01 vs control group, # P<0.05 vs PDT group.